Loading
Cartoon MangoCartoon Mango
Contact Us
AUGMENTED REALITYRETAIL TECH24 MIN READFEB 2026

AR Virtual Try-On for Retail and D2C Brands: Complete Development Guide

Quick Answer

AR virtual try-on increases product page conversion by 61% and reduces return rates by 56%. WebAR (no app download) is the fastest path for Indian D2C brands — costs Rs 10 lakh to Rs 1.5 crore, deploys in 8-12 weeks, and works on mid-range Indian smartphones at 30 FPS. Eyewear and jewelry deliver the highest ROI.

Indian D2C brands lose 25-40% of online orders to returns because customers cannot see how products look on them. AR virtual try-on bridges this gap using smartphone cameras, face tracking, and real-time 3D rendering. This guide covers the full technical architecture, product category strategies, and India-specific optimization for building AR try-on experiences.

61%
Higher Conversion
56%
Fewer Returns
98%
Tracking Accuracy
Rs 10-60L
Development Cost
Categories

AR Try-On by Product Category

Eyewear

95-98% accuracy

Jewelry (Earrings/Necklaces)

90-95% accuracy

Cosmetics (Lipstick/Makeup)

97-99% accuracy

Watches

88-93% accuracy

Apparel (T-shirts/Dresses)

80-88% accuracy

Footwear

82-90% accuracy

Eyewear

95-98% accuracy
Return Reduction

30-40% to 12-18%

Complexity

Medium

3D Model Cost

Rs 1000-3000/SKU

TECH APPROACH: Facial landmark detection (68 points), PBR rendering, IPD measurement
INDIAN BRANDS USING THIS: Lenskart, Titan Eye Plus, John Jacobs
Architecture

6-Layer AR Try-On Architecture

Face/Body Detection Layer

MediaPipe, ARKit, ARCore, TensorFlow.js
Camera feed capture and preprocessingFacial landmark detection (68-point mesh)Body pose estimation (33 keypoints)Hand tracking (21 points per hand)Lighting estimation and normalization
ROI

Before vs After: Commerce Impact

MetricWithout AR Try-OnWith AR Try-OnImprovement
Conversion Rate (Product Page)2.8%4.5%+61%
Return Rate32%14%-56%
Average Order ValueRs 2,400Rs 3,100+29%
Time on Product Page45 seconds2.5 minutes+233%
Add-to-Cart Rate8.5%15.2%+79%
Social Shares per 1000 Users1285+608%
Customer Satisfaction (Post-Purchase)3.4/54.5/5+32%
Reverse Logistics Cost/OrderRs 180Rs 78-57%
Pricing

Cost Breakdown

TierScopeCostIncludesTimeline
Single-Category WebAR1 Product Type (e.g., Eyewear)Rs 10-25 LakhFace tracking, 3D rendering, product catalog (up to 100 SKUs), WebAR deployment, basic analytics8-10 weeks
Multi-Category Platform2-3 Product TypesRs 25-60 LakhMultiple tracking models, PBR rendering, 300+ SKUs, Shopify/WooCommerce plugin, social sharing, advanced analytics12-16 weeks
Full AR CommerceEnterprise / Multi-brandRs 60L - 1.5 CroreAll categories, native + WebAR, AI size recommendation, AR stories, 1000+ SKUs, A/B testing, custom integrations16-20 weeks
3D Catalog ServicePer-SKU ModelingRs 500-5000/SKU3D product modeling (manual or photogrammetry), PBR texturing, optimization, GLTF/USDZ export2-4 hours/SKU
Comparison

Custom vs Off-the-Shelf AR Solutions

FeatureCartoon Mango (Custom)BanubaPerfect CorpOther Global
CustomizationFully custom UI/UX matching your brandTemplate-based, limited brand customizationConfigurable but standardized lookSDK integration, developer effort needed
Indian Market OptimizationTested on 15+ Indian-market phones, low-bandwidth optimizationGlobal standard, no India optimizationGlobal standardNo India-specific testing
Product CategoriesEyewear, jewelry, cosmetics, watches, apparel (custom per category)Face AR (cosmetics, eyewear)Cosmetics primary, eyewear secondaryVaries by vendor
3D Model PipelineIn-house 3D team (Rs 500-5000/SKU, bulk discounts)Client provides models or paid add-onLimited model creation serviceClient must provide 3D assets
Data Ownership100% client-owned data and analyticsPlatform collects usage dataPlatform retains analytics dataVaries, often shared
Pricing ModelRs 10-60L one-time + Rs 1-3L/year maintenance$500-5000/month + per-session fees$1000-10000/month for enterpriseAnnual license $10K-100K+
Shopify/WooCommerce PluginCustom plugin included, one-click installJavaScript SDK (developer integration)Shopify app availableVaries
WebAR SupportFull WebAR — no app download neededWebAR available (add-on pricing)WebAR availableSome vendors, limited
Timeline

12-Week Implementation Roadmap

Weeks 1-2

Technical Feasibility & Design

  • Evaluate product category and tracking requirements
  • Test facial/body tracking accuracy with target products
  • Design UI/UX for try-on experience (Figma prototypes)
  • Select tech stack (WebAR vs native, rendering engine)
Feasibility reportUI/UX designsTech stack decision
Weeks 3-5

Core AR Engine Development

  • Implement face/body tracking pipeline
  • Build 3D rendering engine with PBR materials
  • Develop product placement and sizing algorithms
  • Optimize for target devices (30+ FPS on mid-range phones)
AR engine prototypeTracking accuracy benchmarkDevice compatibility report
Weeks 6-8

Product Pipeline & Catalog Integration

  • Create 3D models for initial product catalog (50-100 SKUs)
  • Build 3D asset management system and CDN pipeline
  • Integrate with e-commerce platform (product page embed)
  • Implement screenshot, video capture, and social sharing
3D catalog readyE-commerce integrationSharing features live
Weeks 9-10

Analytics, Testing & Optimization

  • Build analytics dashboard (try-on sessions, conversion, attribution)
  • Device testing across 15+ Indian-market smartphones
  • Performance optimization (model compression, adaptive quality)
  • A/B testing framework: AR vs standard product page
Analytics dashboardDevice test reportOptimized for Indian devices
Weeks 11-12

Launch & Scale

  • Production deployment with CDN and monitoring
  • Shopify/WooCommerce plugin deployment
  • Team training on 3D model pipeline and catalog management
  • Post-launch monitoring and optimization (2 weeks)
Live production systemPlugin deployedTeam trainedPost-launch report

Get a Free AR Try-On Feasibility Assessment

We will analyze your product catalog, recommend the best AR approach (WebAR vs native), estimate conversion and return impact, and provide a custom development roadmap — free of charge.

Book Free Assessment

Related Services

Retail AR ExperiencesAR/VR SolutionsComputer VisionMobile App DevelopmentRetail AIAI/ML Bangalore

Frequently Asked Questions

Common questions about AI automation for AR virtual try-on for retail and D2C brands

  • What is AR virtual try-on technology?

    AR (Augmented Reality) virtual try-on lets customers visualize products on themselves using their smartphone camera in real-time. For eyewear, the AR engine tracks facial landmarks (68+ points) and overlays 3D glasses models with accurate sizing. For apparel, body mesh estimation maps clothing onto the user's body. For jewelry, hand/ear tracking places rings, earrings, and necklaces accurately. For cosmetics, facial segmentation applies lipstick, foundation, and eye makeup in real-time. The technology uses computer vision (MediaPipe, ARKit, ARCore) and 3D rendering (WebGL, Three.js) to create a realistic preview that reduces purchase uncertainty and returns.

    toggle
  • How much does it cost to build an AR virtual try-on?

    AR virtual try-on development costs in India: Basic single-category try-on (eyewear or lipstick): Rs 10-25 lakh. Multi-category platform (eyewear + jewelry + cosmetics): Rs 25-60 lakh. Full-stack AR commerce platform (try-on + 3D catalog + analytics): Rs 60 lakh to Rs 1.5 crore. Per-SKU 3D modeling: Rs 500-3000 per product (eyewear), Rs 1000-5000 (jewelry), Rs 200-800 (cosmetics shade). Indian development costs are 50-65% lower than US/European AR agencies while delivering equivalent quality using the same underlying frameworks (ARKit, ARCore, WebAR).

    toggle
  • Web AR vs native app AR — which should we build?

    WebAR (browser-based, no app download) is better for: D2C brands wanting zero-friction try-on (customers try from product page directly), higher adoption (no app install barrier — 5-10x more users try), social media integration (Instagram/WhatsApp share links work directly), and faster time to market (8-10 weeks vs 12-16). Native AR (iOS/Android app) is better for: highest visual quality (Apple ARKit/Google ARCore have better tracking), offline capability, push notifications for engagement, and brands with existing apps (Lenskart, Nykaa). Our recommendation: start with WebAR for reach, add native later when you have proven PMF. WebAR handles 85% of use cases at 40% lower cost.

    toggle
  • What products work best with AR virtual try-on?

    Products ranked by AR try-on effectiveness: Tier 1 (highest impact, proven technology): Eyewear (sunglasses, prescription glasses), lipstick/lip color, hair color. Tier 2 (high impact, maturing technology): Jewelry (earrings, necklaces, rings), watches, hats/caps. Tier 3 (growing, needs body tracking): Apparel (t-shirts, dresses — less accurate but improving), footwear (Nike/Adidas level quality requires significant investment). Tier 4 (emerging): Furniture (IKEA-style room placement), home decor, wall art. For Indian D2C brands, eyewear and jewelry deliver the highest ROI because: high return rates without try-on (30-40%), strong visual decision-making, and relatively simple 3D modeling.

    toggle
  • How accurate is AR try-on for eyewear and jewelry?

    Modern AR try-on accuracy: Eyewear — 95-98% size accuracy using facial landmark detection (IPD measurement, temple width, bridge fit). Real-time tracking at 30-60 FPS with head rotation, tilt, and occlusion handling. Lens tint and reflection rendering is photorealistic with PBR (Physically Based Rendering). Jewelry (earrings) — 90-95% accuracy with ear detection models. Necklaces are slightly less accurate (85-92%) due to neck/chest occlusion complexities. Rings — 88-93% accuracy with hand landmark detection. Cosmetics (lipstick) — 97-99% color accuracy using lip segmentation models. The key factors: lighting conditions affect quality (we add lighting normalization), camera quality matters (front-facing cameras on mid-range phones are sufficient), and 3D model quality is critical.

    toggle
  • How does AR try-on reduce return rates?

    AR try-on reduces returns by addressing the top reason for online returns — 'product looked different than expected.' Documented impact: Eyewear — 30-40% return rate drops to 12-18% (industry data from Lenskart, Warby Parker, EyeBuyDirect). Jewelry — 25-35% return rate drops to 10-15%. Cosmetics — 20-30% return rate drops to 8-12% (L'Oreal ModiFace data). Apparel — 35-50% return rate drops to 20-30% (still improving). The mechanism: customers who use AR try-on make more confident purchases, spend 2.5x more time on product pages, and have 40% higher conversion rates. For Indian D2C brands, even a 10% reduction in returns saves Rs 15-40 per order in reverse logistics costs.

    toggle
  • What tech stack is needed for AR virtual try-on?

    Core tech stack: Face/body tracking — MediaPipe (Google, open source), ARKit (Apple), ARCore (Google), TensorFlow.js. 3D rendering — Three.js (web), SceneKit (iOS), Filament (Android), Babylon.js (web alternative). 3D modeling — Blender (free), Substance Painter (textures), Photogrammetry for product scanning. WebAR framework — 8th Wall (commercial, best cross-browser), MindAR (open source), or custom WebGL. Backend — Node.js for 3D asset management, CDN for model delivery, analytics pipeline. Mobile SDK — Swift/ARKit (iOS), Kotlin/ARCore (Android), or React Native with AR bridge. We prefer MediaPipe + Three.js for WebAR (open source, cross-browser) and ARKit/ARCore for native (best tracking quality).

    toggle
  • How do you create 3D models of products for AR?

    Three approaches for 3D product modeling: (1) Manual 3D modeling — artists create models in Blender/Maya from product photos and measurements. Best quality, Rs 1000-5000 per SKU, 2-4 hours per product. (2) Photogrammetry — photograph product from 40-60 angles, software reconstructs 3D model. Faster (1-2 hours per SKU), Rs 500-2000, good for complex shapes. (3) AI-powered 3D generation — emerging tools (Luma AI, Polycam) create 3D from photos/video. Fastest (15-30 min per SKU), Rs 200-500, quality improving rapidly. For eyewear: manual modeling is standard (precise dimensions critical for fit). For jewelry: photogrammetry works well (captures intricate details). For cosmetics: texture mapping only (no 3D model needed, just color). We build automated 3D pipelines so your team can onboard new SKUs without technical expertise.

    toggle
  • Can AR try-on work on low-end smartphones in India?

    Yes, with optimization. The Indian market reality: 60% of smartphones are mid-range (Rs 8,000-20,000), running Android 10+ with basic GPUs. Our optimization approach: (1) Lightweight ML models — we use quantized TensorFlow Lite models (2-5 MB) instead of full models (50-100 MB). (2) Adaptive quality — reduce rendering quality on low-end devices (lower poly count, simplified materials). (3) Progressive loading — show 2D preview while 3D loads in background. (4) WebAR optimization — compressed GLTF models (<2 MB per product), texture atlas, and LOD (Level of Detail) switching. Result: smooth 25-30 FPS try-on on devices like Redmi Note series, Realme, Samsung A-series — covering 80%+ of Indian smartphone users. We test on 15+ Indian-market devices before deployment.

    toggle
  • How long does it take to implement AR virtual try-on?

    Timeline depends on scope: Single-category WebAR (e.g., eyewear only): 8-10 weeks. Multi-category platform: 12-16 weeks. Full AR commerce with analytics: 16-20 weeks. Breakdown for typical eyewear WebAR: Weeks 1-2 — facial tracking integration, camera pipeline setup. Weeks 3-4 — 3D rendering engine, PBR materials, lighting. Weeks 5-6 — product catalog integration, 3D model pipeline. Weeks 7-8 — UI/UX, sharing features, analytics. Weeks 9-10 — device testing (15+ devices), performance optimization, deployment. Additional time for: native app development (+4-6 weeks), body tracking for apparel (+6-8 weeks), initial 3D catalog creation (depends on SKU count — budget 50-100 SKUs per week with our modeling team).

    toggle
  • What analytics does the AR try-on platform provide?

    AR try-on analytics we build: Usage metrics — try-on sessions per day, average session duration, products tried per session, device/browser breakdown. Conversion metrics — try-on to add-to-cart rate, try-on to purchase rate, revenue attributed to AR try-on. Product insights — most tried products (vs most purchased — gap indicates design issues), try-on drop-off by product (indicates 3D quality issues), virtual vs actual purchase match. Customer behavior — repeat try-on users, sharing rate (social proof), time-of-day patterns. A/B testing — AR try-on vs standard product page conversion comparison. These analytics help optimize your catalog, identify products that look great in AR but do not convert (pricing issue), and prove AR ROI to stakeholders.

    toggle
  • Custom AR try-on vs Banuba/Perfect Corp off-the-shelf — which is better?

    Off-the-shelf (Banuba, Perfect Corp, SnapAR) works for: quick deployment (2-4 weeks), standard try-on without customization, brands testing AR before committing. Cost: $500-5000/month + per-session fees. Custom (what we build) is better when: you need brand-specific UI/UX that matches your app/website, you want full data ownership (off-the-shelf platforms collect your customer data), you have 500+ SKUs (per-SKU fees add up quickly), you need custom features (social sharing, AR stories, size recommendation), or you want to avoid platform dependency. Break-even: at 50K+ monthly try-on sessions and 200+ SKUs, custom is more cost-effective within 12 months. We recommend: start with off-the-shelf for POC, migrate to custom once AR try-on proves conversion lift.

    toggle

Want to See What We Build with AR Virtual Try-On Platform?

Get a free consultation and discover how we can turn your idea into a production-ready application. Our team will review your requirements and provide a detailed roadmap.

  • Free project assessment
  • Timeline & cost estimate
  • Portfolio of similar projects

Your information is secure. We never share your data.

We Have Delivered 100+ Digital Products
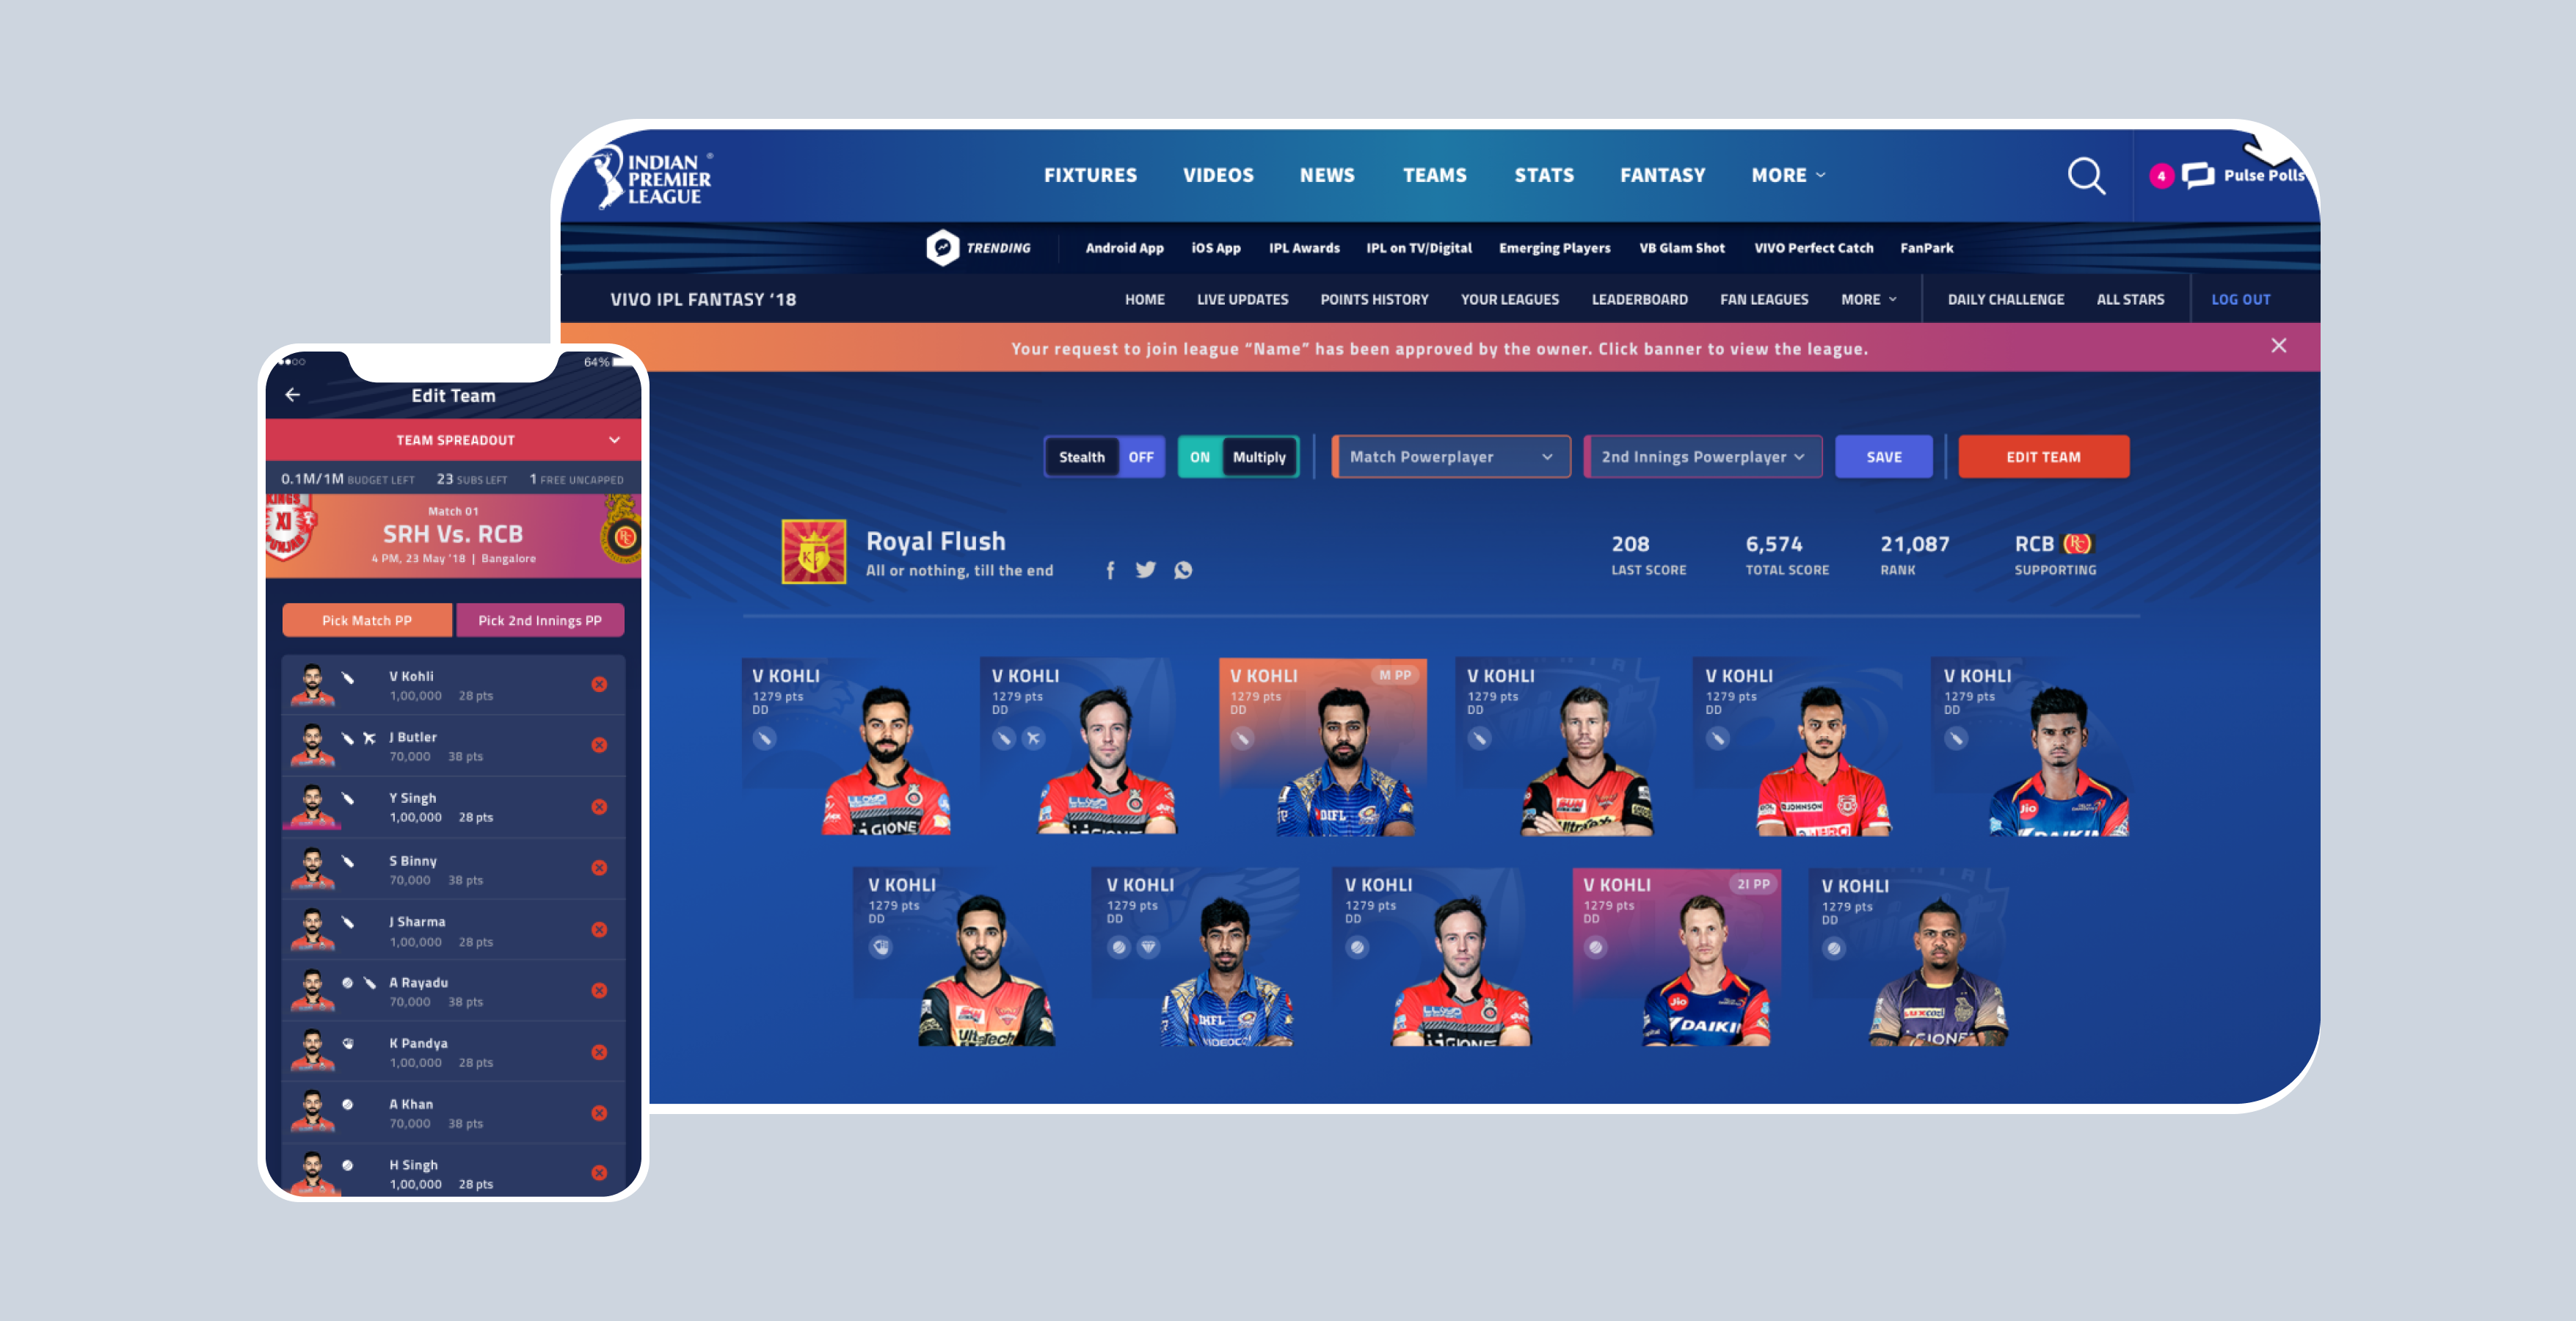
arrow
logo

Sports and Gaming

IPL Fantasy League
Innovation and Development Partners for BCCI's official Fantasy Gaming Platform
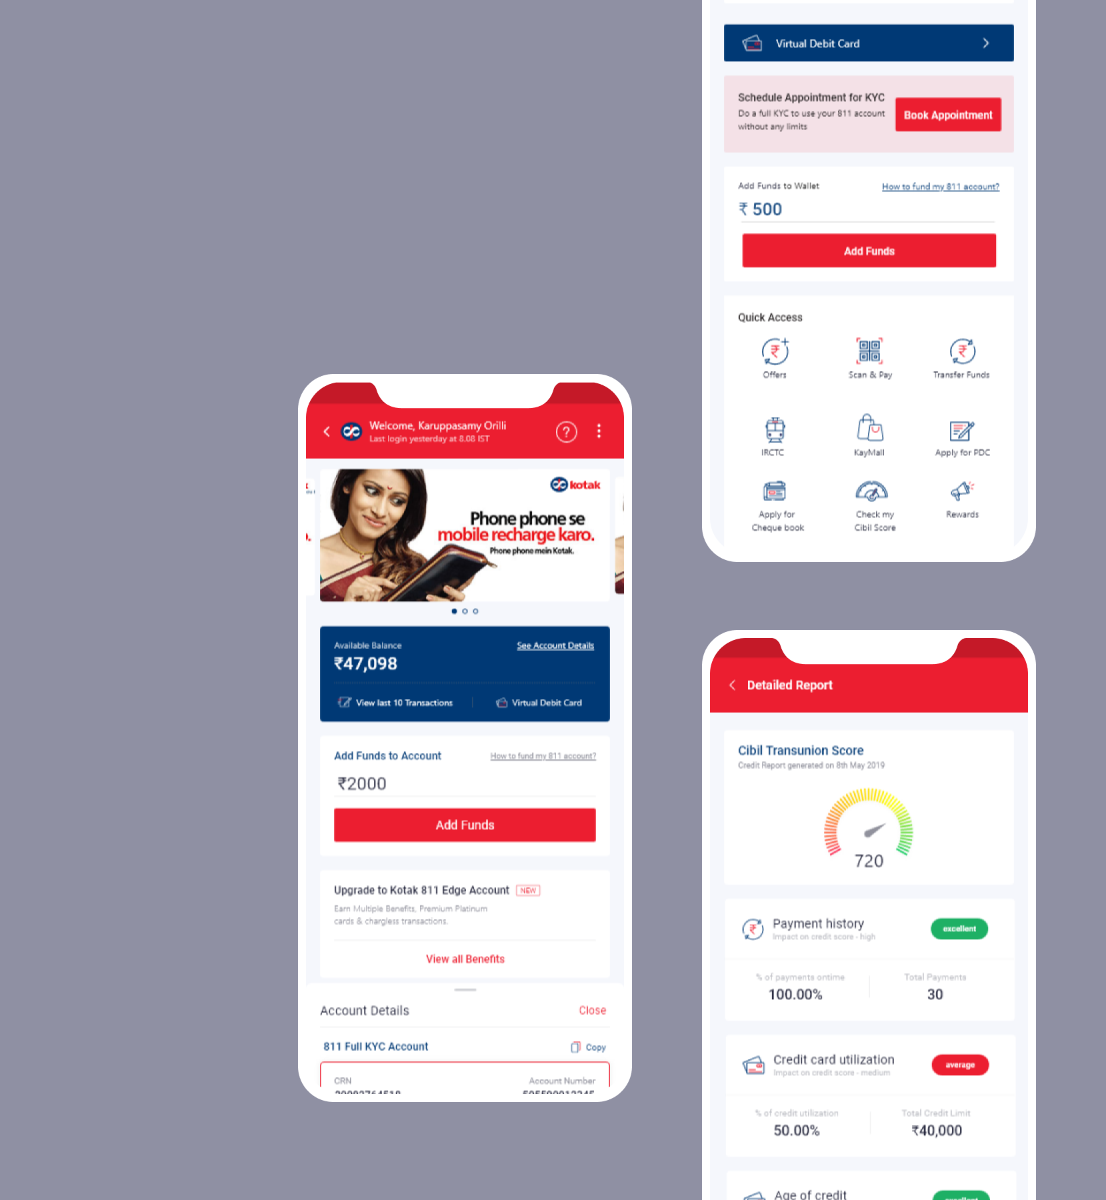
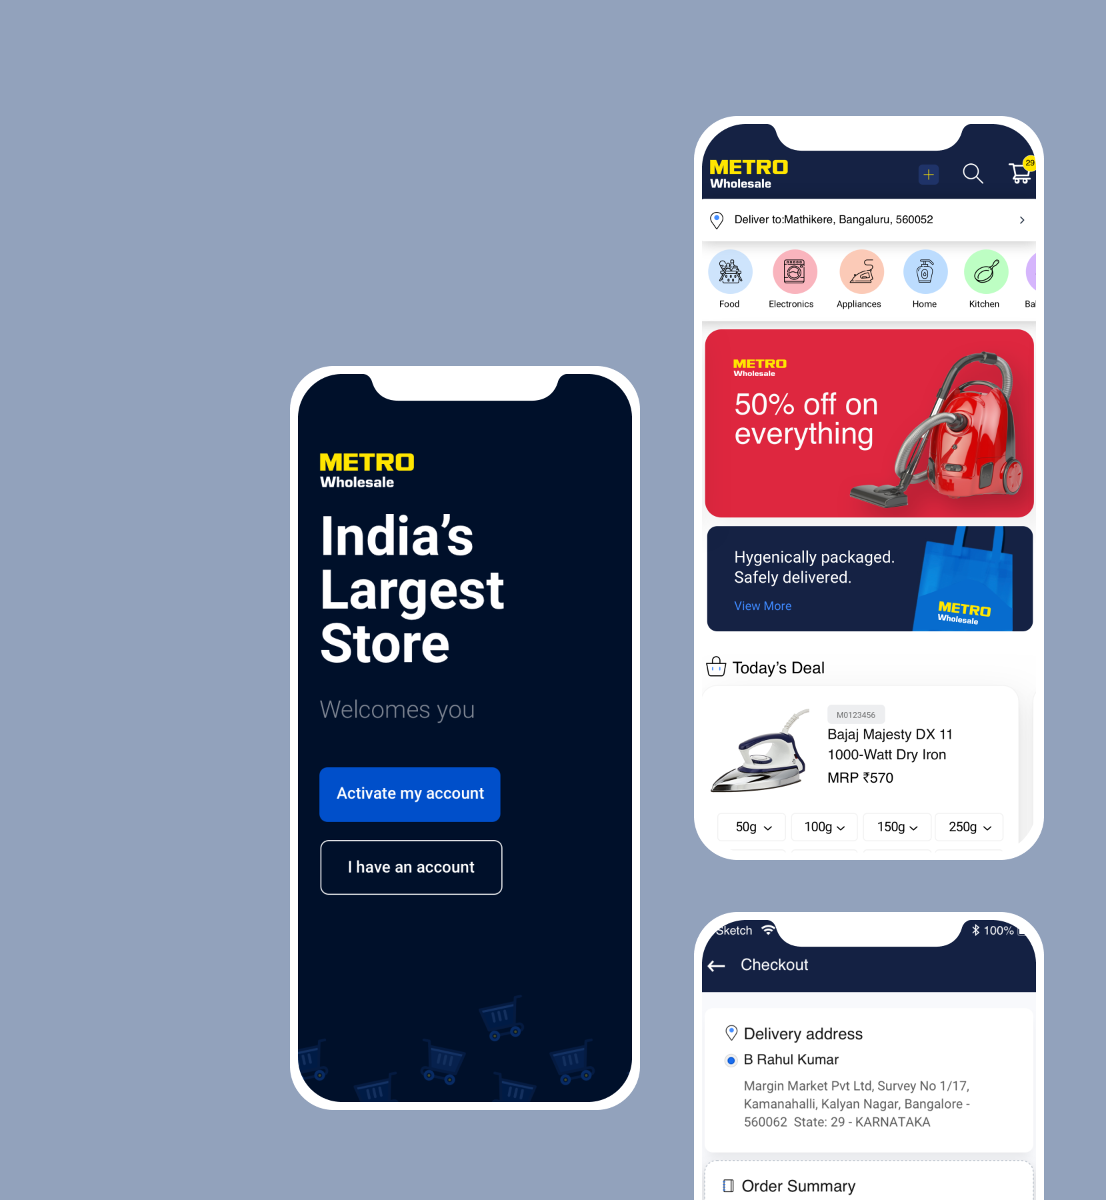
logo

Banking and Fintech

Kotak Mahindra Bank
Designing a seamless user experience for Kotak 811 digital savings account
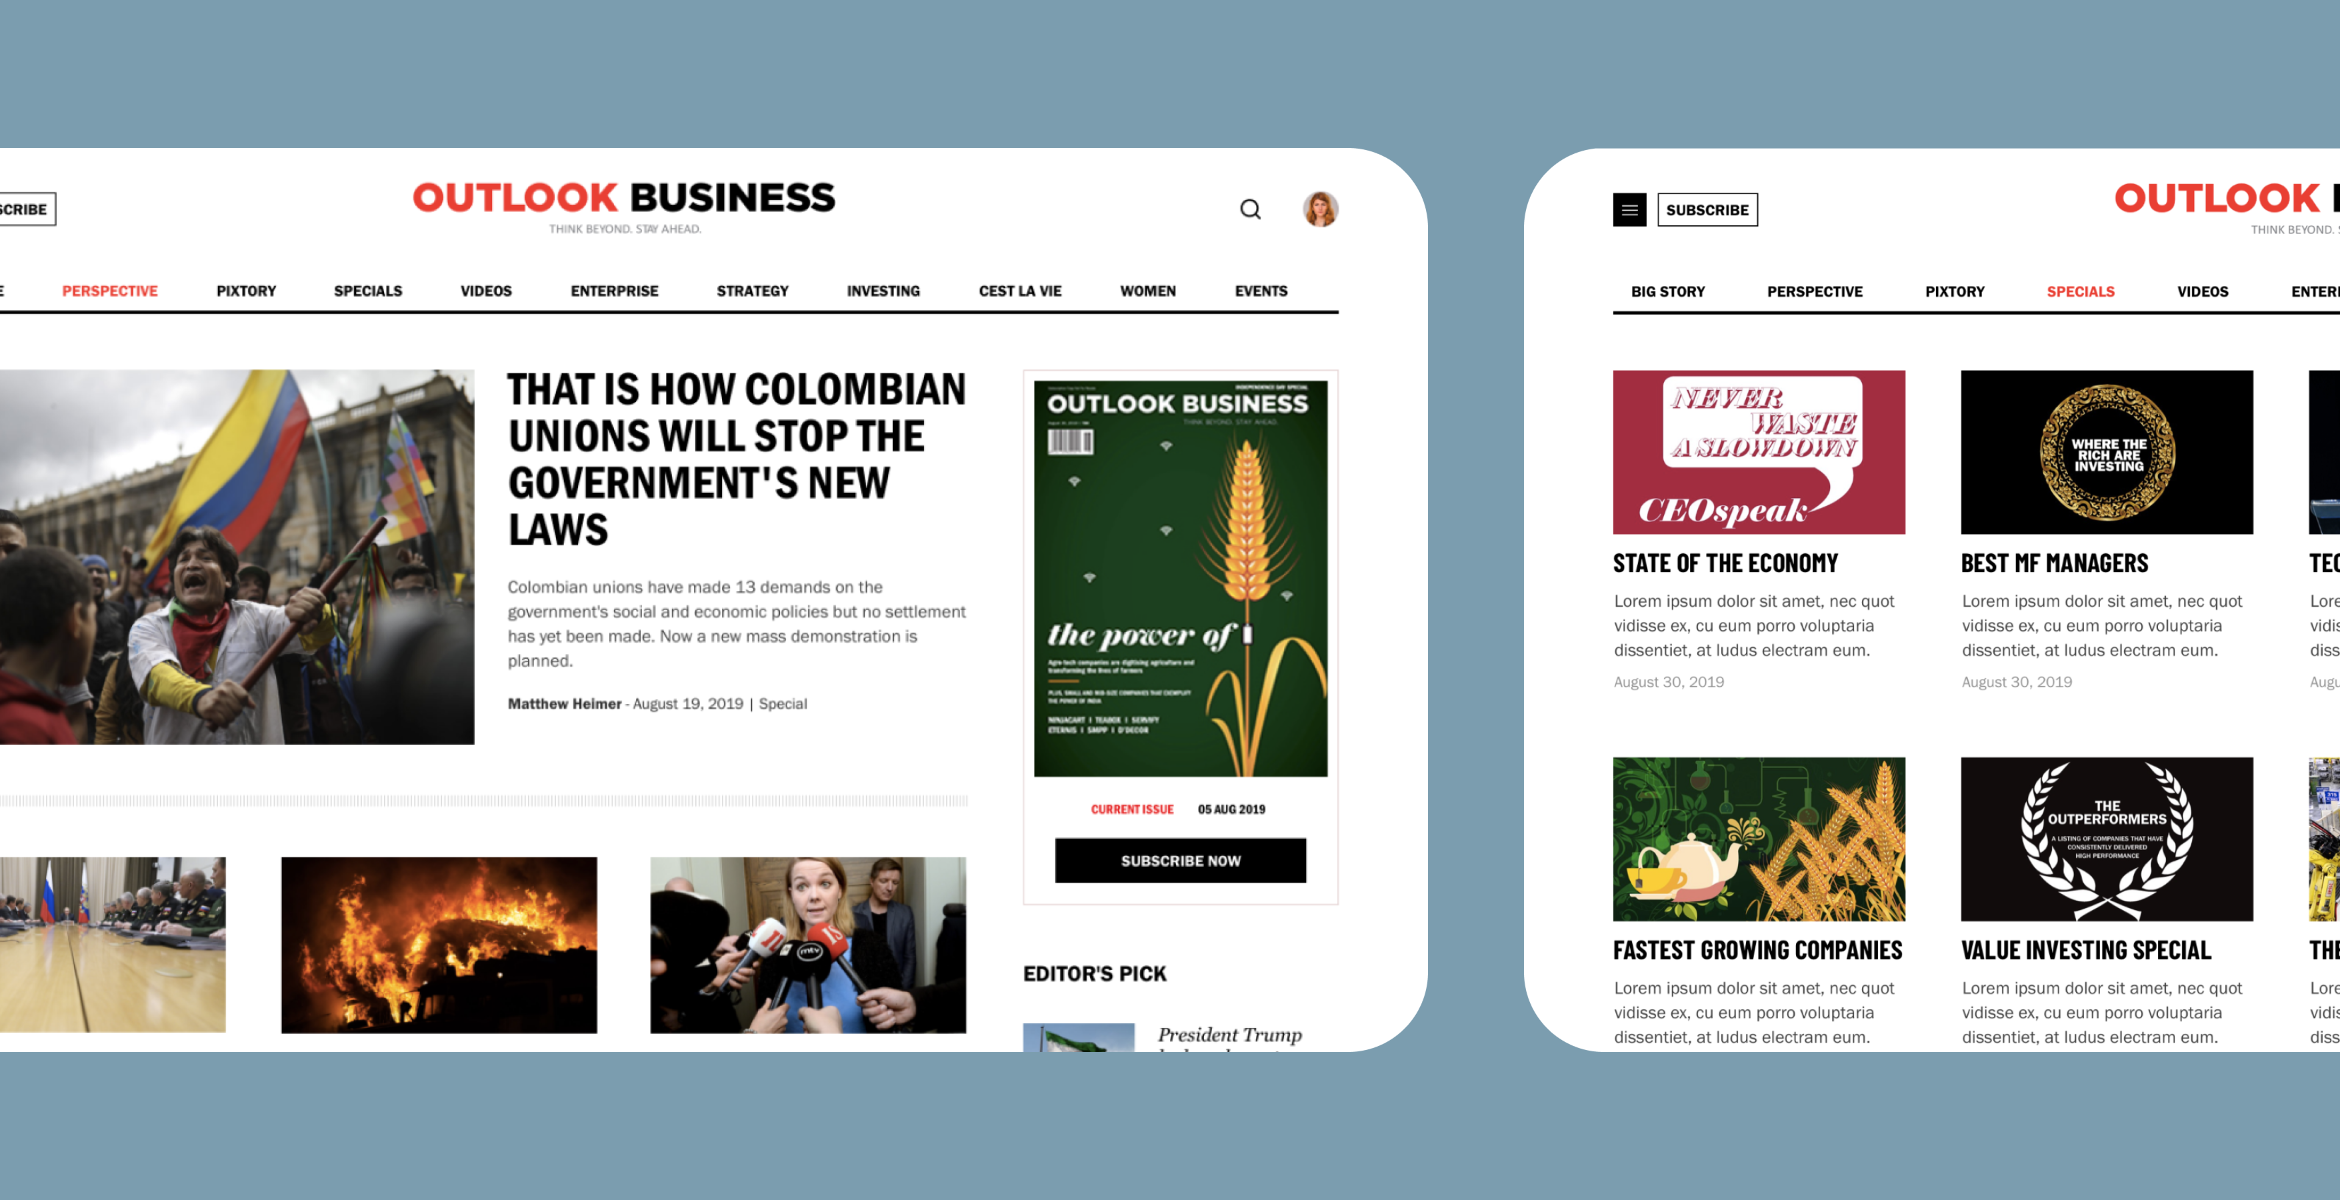
logo

News and Media

News Laundry
Reader-Supported Independent News and Media Organisation
arrow

Written by the Cartoon Mango engineering team, based in Bangalore and Coimbatore, India. We build augmented reality experiences, virtual try-on platforms, 3D product visualization, and computer vision solutions for retail, D2C, and e-commerce brands across India.